| Overview | ||||
| Corner and the durian theory | ||||
| Ashton, Fedorov and evolutionary processes | ||||
| Gentry's hypotheses | ||||
Applications
|
||||
| References and further reading | ||||
| Questions |
For a detailed discussion of methods of allozyme electrophoresis, see references listed below, particularly Richardson et al. (1986) and Kephart (1990). A summary of the procedure used in the lab is given below.
The basic principle of allozyme electrophoresis is to run samples, using an electric current, through a medium (gel) that causes proteins to travel different distances through the gel, depending on size, shape and charge. These gels are then stained for a particular enzyme such that the location of the forms (alleles) of the enzyme are indicated by coloured bands in the gel. The great advantage of allozyme electrophoresis is that heterozygous phenotypes can be identified because the alleles are codominant. By comparison, where there is a dominant allele a heterozygous phenotype cannot be distinguished from a homozygous dominant phenotype (e.g. morphology, RAPDs).
BASIC PRINCIPLES
| 1 |
|
|||
|
2 |
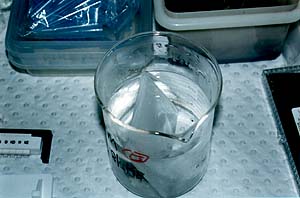
Sample preparation: You will use leaf samples from the Hydrocotyle specimens collected on the field trip. The initial grinding process, and the loading of the gel, needs to be done as quickly as possible to prevent denaturation of the enzymes. Use leaves from 9 different plants plus a standard of Trachymene. Keep a record of sample numbers and the associated plant names and locations. Put each leaf into a separate well in the ceramic spot-plates, with 5 drops of borate grinding buffer, and grind them until a slurry is formed. Make sure that no mixing occurs. Transfer 8µl of each sample into the corresponding well of the loading plate. |
|||
| 3 | 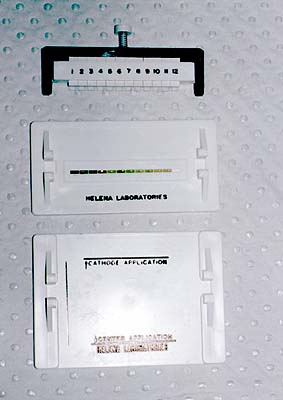 Gel
loading: Carefully remove one gel from the buffer, using forceps,
and blot it dry with blotting paper. Place it, shiny side downwards,
on the alignment plate so that it is lined up for cathode application.
This side of the plate should be nearest to you. Position the applicator
on the loading plate so that the numbers and wells correspond. Depress
the brushes to pick up a sample then move the applicator to the alignment
plate and depress the brushes to transfer samples to the gel. Gel
loading: Carefully remove one gel from the buffer, using forceps,
and blot it dry with blotting paper. Place it, shiny side downwards,
on the alignment plate so that it is lined up for cathode application.
This side of the plate should be nearest to you. Position the applicator
on the loading plate so that the numbers and wells correspond. Depress
the brushes to pick up a sample then move the applicator to the alignment
plate and depress the brushes to transfer samples to the gel. |
|||
|
4 |
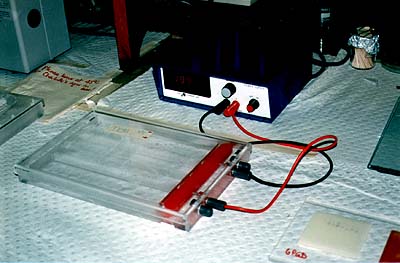 Gel
running: WARNING! The running
of these gels involves high voltage. Always check that the power pack for
your buffer tray is switched off before doing anything with these trays
or gels. Always make sure that the power packs are switched back on if
you have switched them off. The trays have running buffer, Tris maleate,
in place. Position your gels on the paper wicks, shiny side upwards with
the cathode end nearest to the cathode, and make sure there is a good contact.
Switch the power pack on so that it is running at about 199 volts and leave
for the required time (this depends on the enzyme). Gel
running: WARNING! The running
of these gels involves high voltage. Always check that the power pack for
your buffer tray is switched off before doing anything with these trays
or gels. Always make sure that the power packs are switched back on if
you have switched them off. The trays have running buffer, Tris maleate,
in place. Position your gels on the paper wicks, shiny side upwards with
the cathode end nearest to the cathode, and make sure there is a good contact.
Switch the power pack on so that it is running at about 199 volts and leave
for the required time (this depends on the enzyme).
|
|||
| 5 | 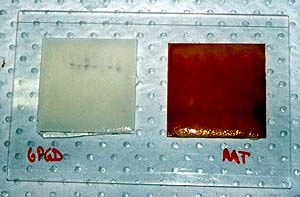 Gel
staining: WARNING! Some
chemicals used in the stains are very nasty (e.g. possible carcinogens).
They are fine as long as you handle them carefully. You will be provided
with gloves, but if you get any stain on your bare hands, wash them immediately.
Obviously, do not get the stains anywhere near your mouth. The stains will
be made up for you. When you have switched of the power pack remove the
gel and place it, shiny side downwards, on the glass plate provided.
Pour about 2cm depth of agar into your stain mixture and immediately pour
this over the gel. Do not move the gel until it has begun to set,
then transfer it to the oven until dry. Depending on the enzyme you
are testing for, you may need to score the bands immediately as they will
fade while drying. Gel
staining: WARNING! Some
chemicals used in the stains are very nasty (e.g. possible carcinogens).
They are fine as long as you handle them carefully. You will be provided
with gloves, but if you get any stain on your bare hands, wash them immediately.
Obviously, do not get the stains anywhere near your mouth. The stains will
be made up for you. When you have switched of the power pack remove the
gel and place it, shiny side downwards, on the glass plate provided.
Pour about 2cm depth of agar into your stain mixture and immediately pour
this over the gel. Do not move the gel until it has begun to set,
then transfer it to the oven until dry. Depending on the enzyme you
are testing for, you may need to score the bands immediately as they will
fade while drying.
|
|||
| 6 | Gel scoring: When bands have come up on gels, score for each
lane as shown in the practice examples.
|
|||
| 7 | Data analysis: Once we have all the results for
the Hydrocotyle taxa being analysed, carry out the following tests:
How does this fit with your conclusions about the taxa from other analyses? |